Time Crystal Research Enters a New Phase

Our world only exists thanks to the diverse properties of the many materials that make it up. The differences between all those materials result from more than just which atoms and molecules form them. A material’s properties also depend on how those basic building blocks are organized in space. For instance, the only difference between a hard diamond and the flaky graphite in pencils is the pattern that carbon atoms form in the material.

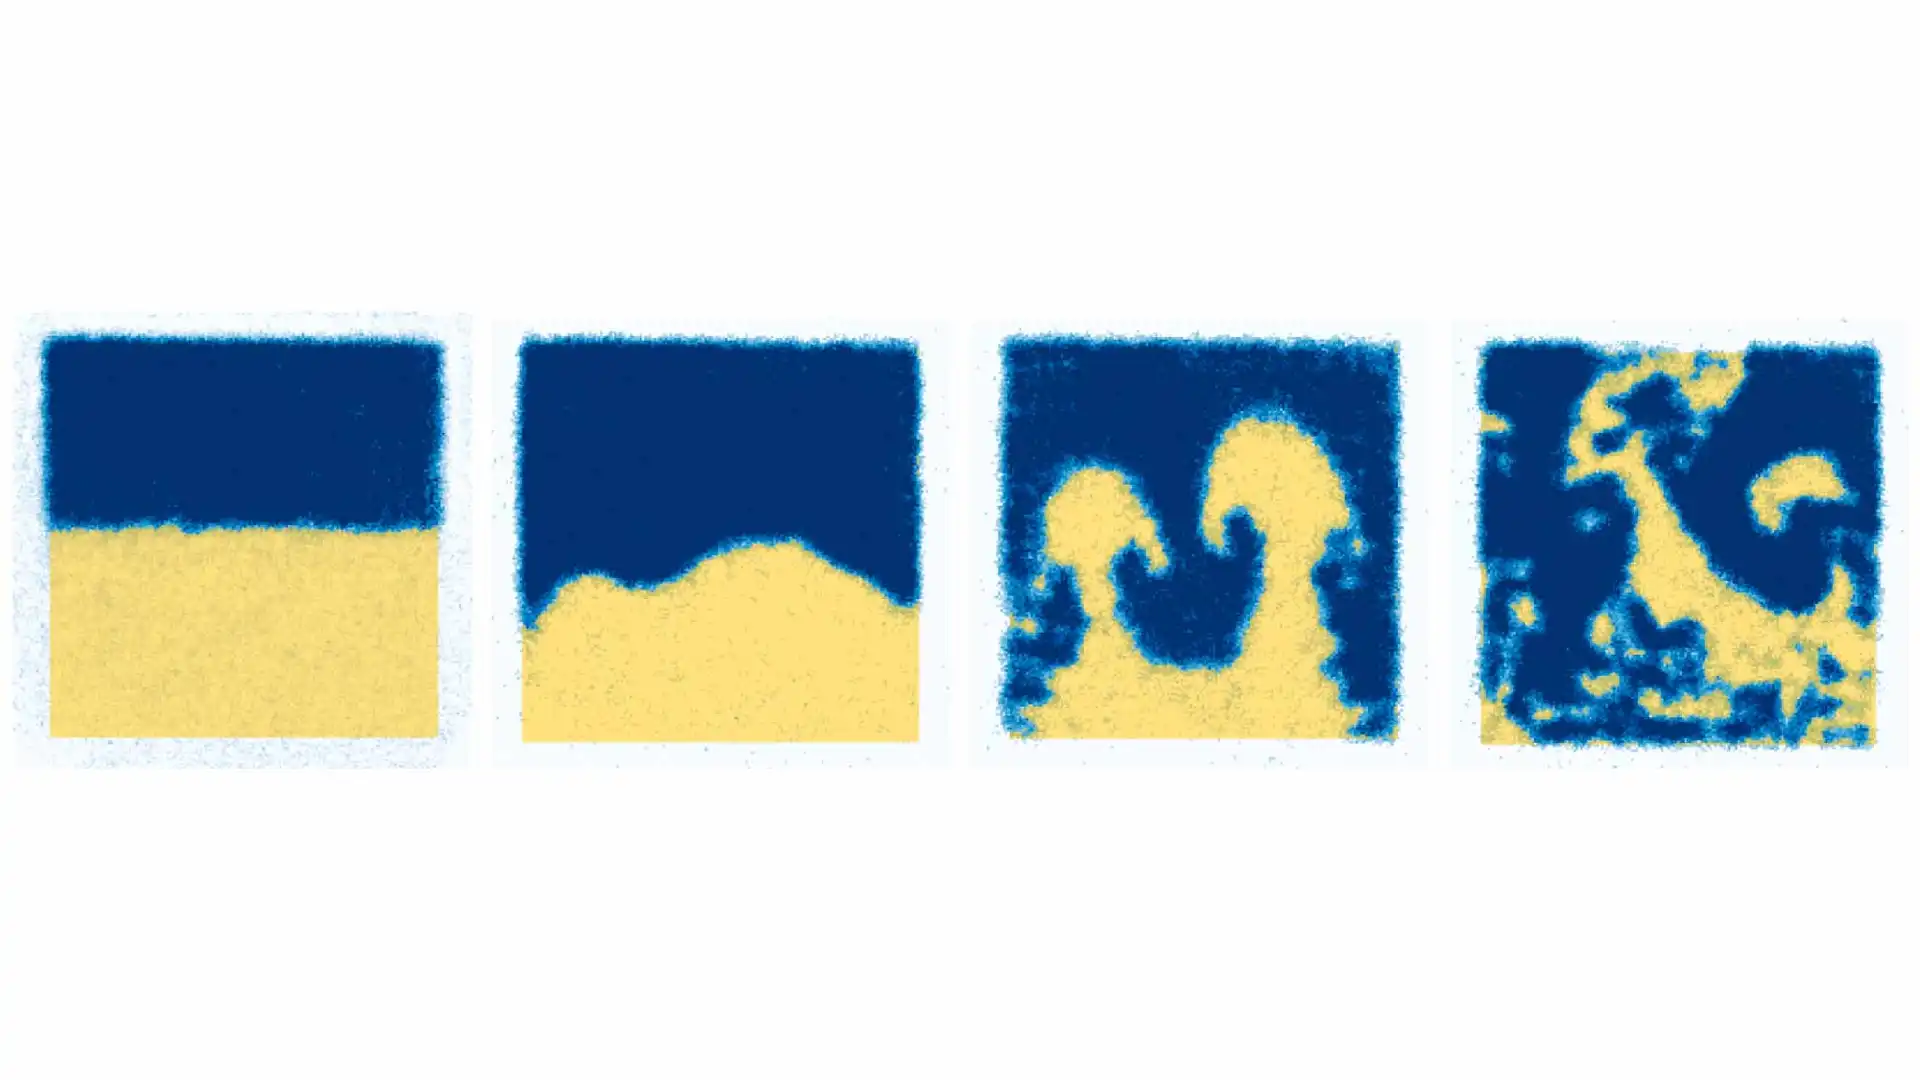
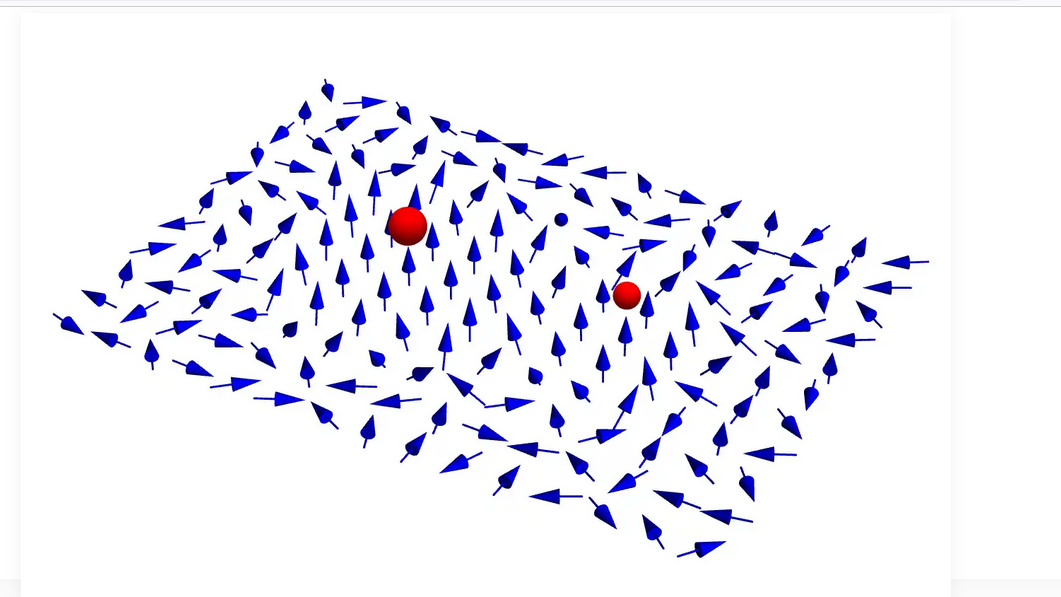
Studying the repeating structures of materials has been instrumental to the field of materials science for the past century. But since 2012, researchers have branched out and started investigating a new type of material in which the basic building blocks order themselves into a stable structure that repeats in time.The pink and green sheets of arrows represent a 2D material in two different states. As time progresses from left to right, the material oscillates between each state, forming a time crystal. The states flip back and forth at half the rate of the force driving them, which is represented by the yellow wave. (Credit: Stuart Yi-Thomas, UMD)The pink and green sheets of arrows represent a 2D material in two different states. As time progresses from left to right, the material oscillates between each state, forming a time crystal. The states flip back and forth at half the rate of the force driving them, which is represented by the yellow wave. (Credit: Stuart Yi-Thomas, UMD)

These special materials are called “time crystals.” (Whether or not a structure makes a pretty jewel, physicists call all solid, orderly structures of repeating atoms or molecules crystals.) Time crystals are collections of particles that undergo repetitive patterns in time, and they can only exist when there is an external force supplying energy to them. But not everything driven into a periodic pattern is a time crystal.

To be a time crystal, the repeating pattern must arise from the interactions of the constituent particles and not just mirror the periodic pattern of the driving force. Additionally, a time crystal’s structure provides stability so that it can maintain its pattern even when the driving force temporarily falters or the time crystal is nudged by another force. (So the pistons of a car engine making the car’s wheels rotate in unison as it drives down the road isn’t an example of a time crystal.)

Researchers have been able to create time crystals in the lab and describe their observed behaviors. However, descriptions of time crystals have generally focused on a particular experimental result and haven’t delved into the theory of what fundamentally makes them form. The lack of a robust theoretical framework leaves many open questions in the field and gives researchers little guidance on which ingredients are useful for creating new time crystals.

In an article published late last year in the journal Physical Review Letters, JQI graduate student Stuart Yi-Thomas and Professor and JQI co-Director Jay Sau presented a new framework for studying time crystals formed from specific ingredients. They made their framework by adapting a widely used and versatile theory for describing phases of matter in quantum systems.

To a physicist, phases of matter refer to more than just solids, liquids and gases and include other organizations of matter such as plasmas, magnets and superfluids. Phases represent distinctive states that a material can be in. When a condition like the temperature, pressure or magnetic field strength varies, a material can switch between phases—undergo a phase transition—and suddenly behave dramatically differently, like water freezing into ice or aluminum becoming superconducting when cooled in liquid helium.

“Time crystals constitute a new phase of matter, which has garnered a lot of excitement in the past decade or so,” says Yi-Thomas who is also a graduate student of the Condensed Matter Theory Center (CMTC). “And heretofore, it has not really been understood as other phases of matter have.”

The framework that Sau and Yi-Thomas crafted allows researchers to study time crystals more like traditional phases and provides insights into when time crystals will form and when they will fall apart.

Some researchers hope that as time crystals become better understood their stability will be put to work as memory in quantum computers.

“The way we use materials and technology is mostly centered around the phases they are in,” says Sau, who is also a member of CMTC. “Solids, liquids, gases, superconductors, metals, insulators and magnets—these are all examples of phases of matter, and their properties are what we use to build technology. So the hope is that once we have other, newer phases we should be able to find technological applications for them.”

To study time crystals as a phase of matter, Sau and Yi-Thomas chose not to focus on an individual time crystal experiment. Instead, they stayed very general and picked out a few well-understood ingredients they thought were promising candidates for forming a time crystal.

The critical ingredient they needed to identify was a type of basic building block that could come together and produce the pattern. The pair focused their investigation on building blocks that all interact with each other and that each is what physicists call an “oscillator,” which means it behaves like a spring or pendulum that can bounce or swing between different states. But Sau and Yi-Thomas didn’t think just any oscillator would work; they wanted a particular type of oscillator—called a non-linear oscillator—that changes how strongly it responds when pushed far enough away from its resting state. There are many types of nonlinear oscillators from car shock springs to microscopic carbon nanotubes to electrical effects in circuits, and Sau and Yi-Thomas didn’t want to specify what sort of non-linear oscillator if they didn’t have to.

Another crucial ingredient to select was an energy input to drive the oscillators back and forth between states. The pair focused on an energy source that would create a phenomenon called “parametric amplification” in a collection of oscillators. Parametric amplification produces oscillating behaviors that reminded them of the repetition of a time crystal, but it comes with an amplification of the oscillations as energy is fed in over time. To get parametric amplification, the frequency of the driving must be selected based on the properties of the oscillators being used.

Then they needed an ingredient to balance the steady increase in energy. So they identified a third simple—but likely necessary—ingredient: friction or some other interaction that can bleed off energy and let the pieces settle into a stable pattern.

Together, these three requirements translate into the constituents of the time crystal needing to be what physicists categorize as “weakly-nonlinear parametrically-driven dissipative coupled oscillators.”

“It sounds very specific because there's a lot of qualifiers, but for this specific model, it's kind of the simplest model we could do,” Yi-Thomas says. “And we expect that similar results would apply to a wide variety of systems.”

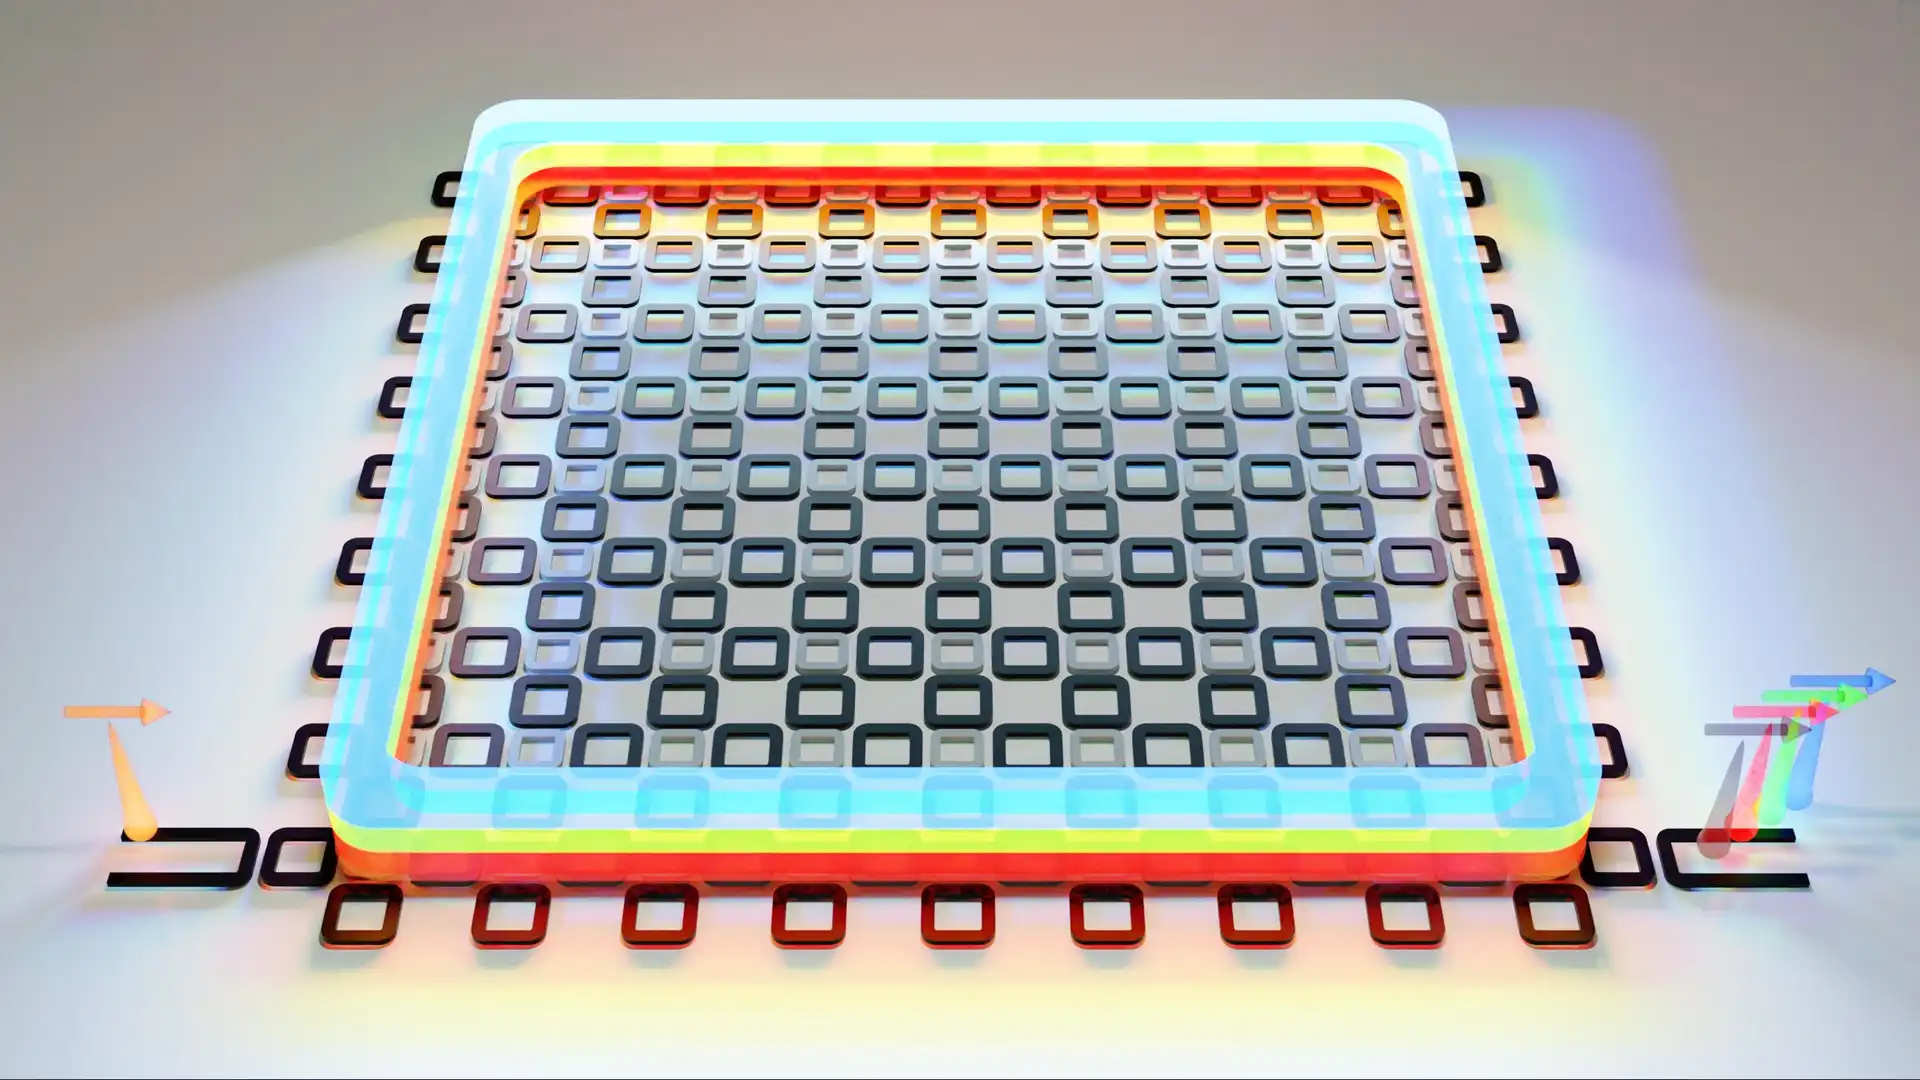
Despite all the demands, several common experimental setups, including certain laser setups and specialized electrical circuits, can check all the identified boxes and thus provide a suitable place to try to make or model new time crystals.

Without worrying about which experimental setup might be used, Sau and Yi-Thomas needed a way to analyze if there are conditions under which their ingredients produce a time crystal. Since they wanted to put time crystals on a similar footing as more traditional phases, they turned to a classic tool for studying phases of matter in quantum systems. That tool, called the Ginzburg-Landau theory, was created to describe superconductivity and the phase transition associated with a material becoming or ceasing to be a superconductor. Over time, physicists have used the same basic math to describe other phases like magnets and Bose-Einstein condensates as well.

The pair adapted the existing theory’s descriptions of phase transitions to apply to the traits they had identified. The resulting framework suggested that experiments with the identified ingredients should be able to form a time crystal.

“To use an idiom, we show that you can build a time crystal with things you can find around the house,” Yi-Thomas says. “You don't need a complex cellular automaton. You don't need many-body localization, or these exotic things. Just with these ubiquitous elements, you can still create a symmetry-breaking phase—a time crystal.”

The paper didn’t argue that using these ingredients is the only way to produce a time crystal but instead highlighted them as promising (and convenient) candidates for researchers to consider.

In the paper, Sau and Yi-Thomas discussed what their new framework revealed about the conditions under which a time crystal should form or break down. They found that the oscillators need to respond with a certain amount of randomness—noise. Just the right amount of noise helps a time crystal lose energy and achieve stability. If there isn’t enough randomness, the steady input of energy tends to introduce too much chaos and make the pieces shift around unpredictably. If instead there is too much randomness in the noise, the randomness itself prevents a stable pattern from emerging. The pair’s calculations suggest a range of possible noise levels that supply an appropriate amount of randomness to form a time crystal.

The pair also tackled the question of whether the stability of a time crystal improves with the number of particles in it, similar to the way normal phases are more stable in larger systems. For instance, the larger a magnet is, the more improbable it will demagnetize or reverse its polarity.

Time crystals might also have an intrinsic stability that increases with size, but many researchers suspect that as experiments increase in size larger time crystals will continue to quickly fall out of their coordinated dances. So Sau and Yi-Thomas looked at larger and larger models of time crystals in their framework to predict whether the crucial stability is doomed to fail or might actually be robust. Their calculations predicted that as time crystals grow, they will experience an increase in stability, similar to magnets and other phases.

Now the framework is available as a tool for researchers investigating a diverse pool of time crystal experiments. Since the theory lays out specific traits that it predicts can create a time crystal, it provides a guide for selecting experiments and conditions that might be fruitful for researchers searching for new time crystals. It also provides a way to predict and study both the conditions under which time crystals fail and when they might experience a shift to a slightly new pattern in time.

Sau and Yi-Thomas hope that other researchers will apply their framework to new time crystal experiments and that research on the time crystal phase of matter will eventually be as robust as research into other phases.

Original story by Bailey Bedford: https://jqi.umd.edu/news/time-crystal-research-enters-new-phase


Mysteriously Mundane Turbulence Revealed in 2D Superfluid

Despite existing everywhere, the quantum world is a foreign place where many of the rules of daily life don’t apply. Quantum objects jump through solid walls; quantum entanglement connects the fates of particles no matter how far they are separated; and quantum objects may behave like waves in one part of an experiment and then, moments later, appear to be particles.

These quantum peculiarities play out at such a small scale that we don’t usually notice them without specialized equipment. But in superfluids, and some other quantum materials, uncanny behaviors can appear at a human scale (although only in extremely cold and carefully controlled environments). In a superfluid, millions of atoms or more can come together and share the same quantum state. 

Acting together as a coordinated quantum object, the atoms in superfluids break the rules of normal fluids such as water, air and everything else that flows and changes shape to fill spaces. When liquid helium turns into a superfluid it suddenly gains the ability to climb vertical walls and escape airtight containers. And all superfluids share the ability to flow without friction.

But these quantum superpowers also come with a limitation. All superfluids are more constrained than normal fluids in how they form vortices where fluid circulates around a central point. Any large vortex in a superfluid must be made up of individual smaller vortices, each with a quantized amount of energy. 

Despite these major differences from normal fluids, one of the lingering mysteries around superfluids is whether they might, in one way, behave in a surprisingly normal manner. The frictionless flow and unique vortices seem like they should make superfluids break the rules of turbulence, which is the chaotic flow of fluids characterized by unpredictable eddies and vortices. However, prior experiments hint at superfluids following the familiar rules anyway, even though they seem to be lacking a normally crucial ingredient: friction.

In normal fluids, the swirling patterns of turbulence are found in many situations, from liquids flowing in rivers, pipes and blood vessels to the atmospheres shifting over the surfaces of planets to the air passing around airplanes and golf balls. In the early 1940s, the Soviet mathematician Andrey Kolmogorov introduced a theory that describes the statistical patterns common to turbulence and relates them to the way energy moves through different size scales in fluids. 

Even though superfluids lack the seemingly crucial ingredient of friction, prior experiments have shown signs that superfluids may experience turbulence that follows rules similar to those described by Kolmogorov. But comparisons have been hampered since superfluid research relies on different tools than experiments studying regular fluids. In particular, superfluid research hasn’t been able to measure velocities at distinct points within a type of superfluid called a Bose-Einstein condensate (BEC). Maps showing the velocity at each point, which physicists call a “velocity field,” are a basic tool for understanding fluid dynamics, but when studying superfluid behaviors, researchers have largely navigated their quantum quirks without that useful guide.

Now, a new technique developed by Joint Quantum Institute researchers has introduced a tool for measuring velocities in a BEC superfluid and applied it to studying superfluid turbulence. In a paper published as an Editors’ Suggestion in Physical Review Letters on February 25, 2025, JQI Fellow and Adjunct Professor Ian Spielman, together with Mingshu Zhao and Junheng Tao, who both worked with Spielman as graduate students and then postdoctoral researchers at JQI, presented a method of measuring the velocity of currents at specific spots in a BEC superfluid made from rubidium atoms. For the technique to work, they had to keep the BEC so thin that it could effectively move in only two dimensions. In the paper, they shared both the first direct velocity field measurements for a rotating atomic BEC superfluid (which wasn’t experiencing turbulence) and an analysis of how the velocities in a chaotically stirred-up superfluid compared to normal turbulence.

The new paper is the culmination of Zhao’s graduate and postdoctoral work at JQI, which was dedicated to developing a way to measure the individual velocities in superfluid currents. Spielman, who was Zhao’s advisor and is also a physicist at the National Institute of Standards and Technology and a Senior Investigator at the National Science Foundation Quantum Leap Challenge Institute for Robust Quantum Simulation, encouraged him to apply the new tool to one of the most challenging problems in the field: quantum turbulence. 

“From his first day in the lab Mingshu was interested in developing techniques for measuring the velocity field of a BEC, and after many dead-ends I am really excited that we found a technique that works,” Spielman says.

Previous experiments exploring superfluid turbulence only obtained information about what velocities were present in a superfluid overall, without learning anything about which parts of the superfluid moved at which velocities. Having the bulk data from these measurements is like knowing how many roads in a state have a certain speed limit but not knowing anything about the speed limit on any particular road. Those prior experiments showed signs that superfluids might experience turbulence similar to normal fluids but weren’t enough to settle the question. The measurements could also be compatible with a new form of turbulence requiring its own mathematical description.

To measure velocities at distinct points within a superfluid, Zhao and his colleagues decided to introduce tracers—objects that would move with the superfluid, wouldn’t disrupt its state, and would be easy to spot. Using tracers is like dropping rubber ducks into a stream or scattering confetti in the wind to reveal where the currents flow. 

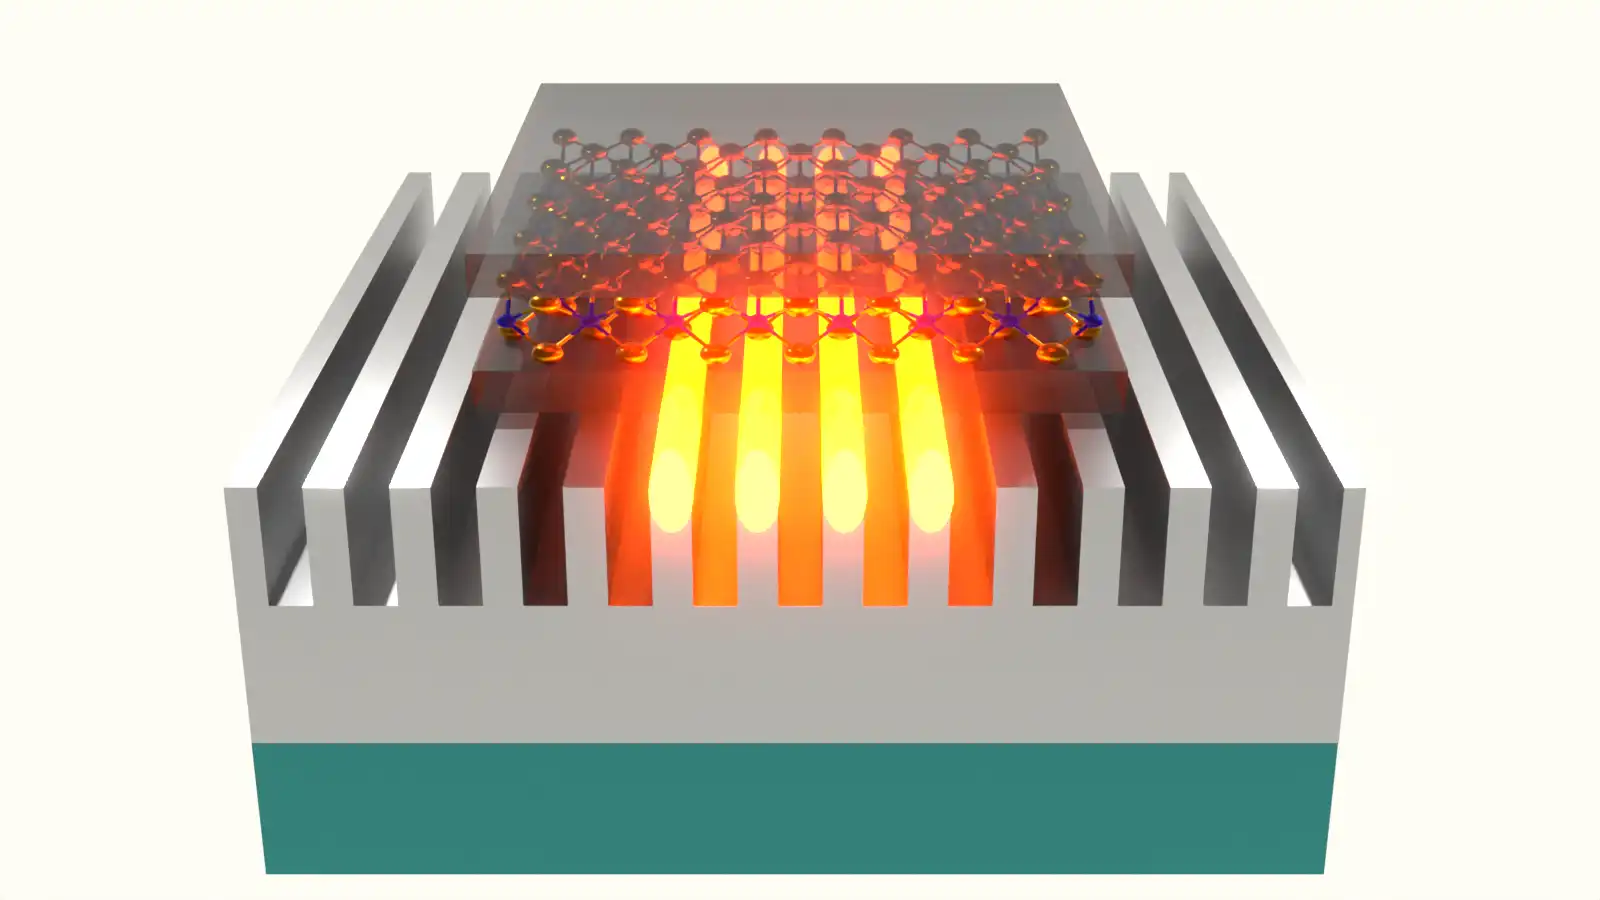
But rubber ducks, confetti and even most tiny things would be impractical in the experiment and disrupt the delicate quantum state of the superfluid. The team realized they didn’t need to introduce something new; everything they needed was already in their experiment. Their innovation was to intentionally knock some of the rubidium atoms in the superfluid into a new quantum state that could be easily detected. Each atom in the BEC acts like a tiny magnet—it has the quantum property of spin—and wants to point along any magnetic field supplied in the lab. By shooting a precisely calibrated laser at sections of the BEC, they could impart enough energy to knock some of the spins of the atoms into pointing in a new direction. These new off-kilter states are called “spinor impurities.” 

Spinor impurities work as tracers in the superfluid because they respond differently to light than the rest of the atoms. The team selected a second laser that would pass through the rest of the superfluid but be absorbed by the spinor impurities. When the researchers shone the laser on the superfluid, the shadows cast by the tracers marked their positions. 

However, the spinor impurities weren’t perfect tracers. Absorbing the light also knocked the spinor impurities out of the superfluid, so the team only got one chance to check in on each tracer’s journey. During the experiment, this meant they could only get one velocity measurement per tracer. Also, the researchers could use only a limited number of tracers per run and had to check in on them quickly. Each tracer is made of many spinor impurities that naturally diffuse. Instead of behaving like a rubber duck that can be followed indefinitely, the tracers behave more like a drop of food coloring added to swirling water that spreads out as it travels. The team couldn’t wait too long to observe a tracer lest it diffuse into a useless cloud. They also couldn’t pack very many tracers into one experiment as they tended to overlap quickly and become indistinguishable.

So the tracers allowed Zhao and his colleagues to measure velocities at distinct spots, but the researchers couldn’t continuously watch as the tracers followed the currents in real time. To get a complete picture of the velocity field they had to instead take a bunch of snapshots a few points at a time and then combine them into a collage showing the velocity field.

Using just two to four tracers at a time, the team first tested the technique by measuring non-turbulent flow. They spun the superfluid’s container at a slow and steady rate that theory predicted would create a particular current pattern in the superfluid but wouldn’t create a superfluid vortex. Piecing together several measurements gave them an overall view of how the superfluid was flowing. Their results were the first direct visualization of a flow pattern in a rotating atomic BEC superfluid.

An example of a non-turbulent velocity field measured using the new technique. (Credit: Mingshu Zhao, UMD)An example of a non-turbulent velocity field measured using the new technique. (Credit: Mingshu Zhao, UMD)The same methodical approach can’t work for mapping turbulence. Turbulence is characterized by chaos with currents shifting into new directions, so images from subsequent observations wouldn’t fit together to show continuous currents in a velocity field. The result would just be a mess of unrelated velocities.

Since Zhao and his colleagues couldn’t map out turbulent currents in the BEC, they had to instead resort to statistics describing the relationship of velocity measurements taken at just a couple of points at a time. The randomness of turbulence means that Kolmogorov’s theory relies on a statistical description of how distant velocities tend to be related to each other in turbulent flows and doesn’t provide exact predictions of velocity fields. Despite the velocity varying randomly at every point in turbulence, Kolmogorov still identified a pattern in the average way that the differences in velocities at two points tend to depend on the distance between them. So repeatedly observing just two points at a time and then analyzing them as a group can be enough to check if the velocities might fit Kolmogorov’s traditional description of turbulence.

“Kolmogorov just gives a very good explanation for those statistics in turbulence,” Zhao says. “And to get the statistics, he used a very interesting idea—the energy cascade.”

The cascade of energy describes the flow of energy from large scales down to the smallest scales where it is lost. It arises because whatever stirring, blowing or other source of motion introduces energy into a fluid usually plays out over the largest distances involved in the fluid’s flow, but that energy doesn’t stay at that scale. The energy and motion inevitably transition through an intermediate scale before being lost at the smallest scale where atoms and molecules interact. 

The size of the large scale varies from one case to the next and depends on how the motion is introduced. For instance, motion can come in as currents of heat blowing smoke up over a fire, a spoon stirring a teacup or a waterfall crashing into a pool. But the energy and motion don’t stay at that scale; eventually, most of it is lost at a small scale, generally from friction. Ultimately, energy is lost as the moving smoke pulls along calmer cooler air, the tea drags against the teacup and cool air, and the water crashes against rocks and tugs along calmer water. The energy must get from the initial large sweeping scales to the small scales where it is lost, and that transfer occurs at the medium scale where energy moves with almost no loss.

This energy cascade across scales results in vortices and has been observed in a broad array of fluids and situations. Kolmogorov identified the cascade of energy and the statistical description of the resulting turbulent fluid motion.

Sometimes, though, even in regular fluids, things get more complicated. In particular, experiments looking at the rare cases of two-dimensional fluid flows suggest that in addition to the regular energy cascade they experience an inverse energy cascade process. In an inverse energy cascade, some of the energy gets lost at a scale even larger than the scale where it was introduced.

To see what their two-dimensional superfluid did, Zhao and his colleagues needed to stir up currents that might be turbulent. They were able to use laser beams aimed at the flat superfluid as “stirring rods.” Using a precision array of adjustable mirrors, they maneuvered the two lasers around the superfluid. Before introducing the tracers for each measurement, they briefly set the two stirring rods moving in opposite directions, tracing random loops around the superfluid. (Since the two rods were made of light, the researchers didn’t have to worry about them colliding on their random circuits like actual rods or spoons would.)

They took many measurements of velocities two points at a time shortly after stirring the superfluid up. They also measured the superfluid’s density. Combining the density data with their statistical analysis of the how the velocities at different points compared provided them with a new way to compare the superfluid’s behavior to Kolmogorov’s theory. The team’s data matched the theory, but with a twist: It matched what is expected for normal fluid turbulence in three dimensions, despite their superfluid being effectively confined to two.

The result left lingering mysteries. Since superfluids don’t have friction to remove energy at the smallest scales, what produces the turbulence in superfluids? And why does a two-dimensional superfluid behave like normal fluids flowing in three dimensions?

The team speculated that instead of friction, it is the superfluid losing particles that removes energy and creates turbulence. To investigate, Zhao and his colleagues performed numerical simulations where atoms escaped from the experiment and compared it to their results. They found that their data aligned with the simulations, and both were consistent with the superfluid experiencing turbulent flow that matched Kolmogorov’s theory. 

The researchers also presented a possible cause of the turbulence of their two-dimensional superfluid resembling that of three-dimensional regular fluids. They argued that the inverse energy cascade in two-dimensional regular fluids requires that the fluid be incompressible—adding pressure won’t pack more fluid into a small space and create extra room. The BEC superfluid used in the experiment can easily be compressed and packed into small areas, unlike water and many normal fluids. That difference likely prevented the inverse cascade and produced the more mundane turbulence like is normally seen in three-dimensional fluids. The researchers also identified an additional constraint on superfluids that was not present in their experiment but might recreate the effect of incompressibility and produce an inverse energy cascade in other two-dimensional superfluids. 

“With this experimental method, you can study quantum fluids better than ever,” Zhao says. “With this, we have more information. We have more subjects to study. We can see the statistics better for the turbulence experiments, and we will have a better understanding from that.” 

Zhao says he hopes to do further simulations that more realistically show how the dissipation likely occurred in their experiment. However, signs of turbulence have been observed in other superfluids that likely have different dissipation processes that will likely require slightly different explanations. Zhao also hopes that this isn’t the only tool invented for measuring velocities in atomic superfluids since techniques compatible with other types of superfluids and experimental setups could reveal additional physics hiding beneath the surfaces of superfluids.

Original story by Bailey Bedford: https://jqi.umd.edu/news/mysteriously-mundane-turbulence-revealed-2d-superfluid


A New Piece in the Matter–Antimatter Puzzle

aOn March 24, 2025 at the annual Rencontres de Moriond conference taking place in La Thuile, Italy, the LHCb collaboration at CERN reported a new milestone in our understanding of the subtle yet profound differences between matter and antimatter. In its analysis of large quantities of data produced by the Large Hadron Collider (LHC), the international team found overwhelming evidence that particles known as baryons, such as the protons and neutrons that make up atomic nuclei, are subject to a mirror-like asymmetry in nature’s fundamental laws that causes matter and antimatter to behave differently. The discovery provides new ways to address why the elementary particles that make up matter fall into the neat patterns described by the Standard Model of particle physics, and to explore why matter apparently prevailed over antimatter after the Big Bang. View of the LHCb experiment in its underground cavern (image: CERN)  View of the LHCb experiment in its underground cavern (Credit: CERN) View of the LHCb experiment in its underground cavern (image: CERN) View of the LHCb experiment in its underground cavern (Credit: CERN)

First observed in the 1960s among a class of particles called mesons, which are made up of a quark–antiquark pair, the violation of “charge-parity (CP)” symmetry has been the subject of intense study at both fixed-target and collider experiments. While it was expected that the other main class of known particles – baryons, which are made up of three quarks – would also be subject to this phenomenon, experiments such as LHCb had only seen hints of CP violation in baryons until now.

“The reason why it took longer to observe CP violation in baryons than in mesons is down to the size of the effect and the available data,” explains LHCb spokesperson Vincenzo Vagnoni. “We needed a machine like the LHC capable of producing a large enough number of beauty baryons and their antimatter counterparts, and we needed an experiment at that machine capable of pinpointing their decay products. It took over 80 000 baryon decays for us to see matter–antimatter asymmetry with this class of particles for the first time.”

Particles are known to have identical mass and opposite charges with respect to their antimatter partners. However, when particles transform or decay into other particles, for example as occurs when an atomic nucleus undergoes radioactive decay, CP violation causes a crack in this mirror-like symmetry. The effect can manifest itself in a difference between the rates at which particles and their antimatter counterparts decay into lighter particles, which physicists can log using highly sophisticated detectors and data analysis techniques. 

The LHCb collaboration observed CP violation in a heavier, short-lived cousin of protons and neutrons called the beauty-lambda baryon Λb, which is composed of an up quark, a down quark and a beauty quark. First, they sifted through data collected by the LHCb detector during the first and second runs of the LHC (which lasted from 2009 to 2013 and from 2015 to 2018, respectively) in search of the decay of the Λb particle into a proton, a kaon and a pair of oppositely charged pions, as well as the corresponding decay of its antimatter counterpart, the anti-Λb. They then counted the numbers of the observed decays of each and took the difference between the two.

The analysis showed that the difference between the numbers of Λb and anti-Λb decays, divided by the sum of the two, differs by 2.45% from zero with an uncertainty of about 0.47%. Statistically speaking, the result differs from zero by 5.2 standard deviations, which is above the threshold required to claim an observation of the existence of CP violation in this baryon decay.

While it has long been expected that CP violation exists among baryons, the complex predictions of the Standard Model of particle physics are not yet precise enough to enable a thorough comparison between theory and the LHCb measurement.

Perplexingly, the amount of CP violation predicted by the Standard Model is many orders of magnitude too small to account for the matter–antimatter asymmetry observed in the Universe. This suggests the existence of new sources of CP violation beyond those predicted by the Standard Model, the search for which is an important part of the LHC physics programme and will continue at future colliders that may succeed it.

“The more systems in which we observe CP violations and the more precise the measurements are, the more opportunities we have to test the Standard Model and to look for physics beyond it,” says Vagnoni. “The first ever observation of CP violation in a baryon decay paves the way for further theoretical and experimental investigations of the nature of CP violation, potentially offering new constraints for physics beyond the Standard Model.”

The UMD members of the LHCb collaboration include professors Hassan Jawahery, Manuel Franco Sevilla and Phoebe Hamilton; postdoctoral associates Christos Hadjivasiliou, Lucas Meyer Garcia, and Parker Gardner; graduate research assistants Alex Fernez, Emily Jiang and Elizabeth Kowalczyk and undergraduate student Othello Gomes.

 “I congratulate the LHCb collaboration on this exciting result. It again underlines the scientific potential of the LHC and its experiments, offering a new tool with which to explore the matter–antimatter asymmetry in the Universe,” says CERN Director for Research and Computing, Joachim Mnich.

Researchers Play a Microscopic Game of Darts with Melted Gold

Sometimes, what seems like a fantastical or improbable chain of events is just another day at the office for a physicist.

In a recent experiment by University of Maryland researchers at the Laboratory for Physical Sciences, a scene played out that would be right at home in a science fiction movie. A tiny speck glinted faintly as it hovered far above a barren, glassy plain. Suddenly, an intense green light shone toward the ground and enveloped the speck, now a growing dark spot like a meteorite or UFO descending in the emerald beam. Once the object crashed into the ground, the light abruptly disappeared, and the flat landscape was left with a new landmark and treasure for physicists to find: a chunk of gold rapidly cooling from a molten state.

This scene, which played out at a minuscule scale in repeated runs of the experiment, was part of a research project on nanoparticles—objects made of no more than a few thousand atoms. Each piece of gold was a bead hundreds of times smaller than the width of a human hair. In each run, the golden projectile was melted by a green laser and traveled almost a million times its own length to land on a glass slide.

Nanoparticles interest scientists and engineers because they often have exotic and adaptable properties. Unlike larger samples of a material, a nanoparticle can undergo dramatic changes with only small tweaks to its environment or size. For instance, a tiny gold nugget in a California stream has the same melting point, reflectivity and thermal conductivity as a 400-pound block of gold in Central Park, but two gold nanoparticles that differ in diameter by mere billionths of a meter have significantly different properties from the large pieces and, more importantly, each other.

The broad range of properties that nanoparticles have makes them a versatile toolbox for researchers and engineers to draw from. For example, people have used gold-based nanoparticles to detect the influenza virus, deliver medications in the body, and achieve a variety of vibrant colors in stained glass. However, since nanoparticles are so small and easily influenced, researchers must use a variety of specialized tools to study them.

When examining nanoparticles, some properties are best measured by tools—like a scanning electron microscope (SEM)—that get up close and personal with the sample. An SEM can get phenomenal detail on the size and shape of a nanoparticle if it is attached to a larger material that is easy to move and handle. However, the small size of nanoparticles can make other properties, like how they conduct heat, almost impossible to measure if they are touching anything. The mere presence of larger objects can often alter a nanoparticle’s properties or drown out its interaction with the measurement device. Fortunately, many nanoparticles can be isolated from the influence of other materials by using electric fields to levitate them, allowing researchers to use lasers to study certain properties, like heat conduction, from a distance.

JQI Fellow Bruce Kane and UMD researcher Joyce Coppock perform levitation experiments to study tiny pieces of graphene, which are sheets of carbon atoms. And in their quest to develop new tools, they have also turned their attention to tiny gold beads.

However, Kane and Coppock aren’t satisfied with the insights available from levitation experiments alone. They want the best of both worlds: to measure a sample levitated in isolation and then recover it for direct inspection. So, the pair are developing a method to recover tiny samples after they are released from the fields levitating them. In a paper published in Applied Physics Letters, the pair described how they were able to deposit gold nanoparticles on a slide after levitation and how they refined the technique to hone their aim. They hope mastering the process with gold will be useful in future experiments depositing more finicky graphene samples.

Before experimenting with depositing gold, Kane and Coppock had initially tried depositing graphene nanoparticles. Levitation is important for studying graphene on its own because its thickness—just a single atom—makes it challenging to study certain properties when it’s sitting on top of another material. For instance, a bulky material under a piece of graphene generally retains or moves heat around much more dramatically than the graphene, overwhelming any attempts to measure the heat conduction of the graphene itself. Additionally, simply sitting atop another material is often enough to stretch or squeeze a graphene sample in ways that change important properties, like its electrical resistance.

To avoid these issues, Kane and Coppock typically levitate their graphene samples in a vacuum. But the properties best measured directly without levitation are required to get a complete picture of a nanoparticle.

Ideally, Kane and Coppock would like to do both styles of measurement on individual nanoparticles. However, the existing levitation procedure makes it impractical either to perform direct probes on a sample before levitating it or to recover a sample once they remove the electric fields. That’s because there isn’t a convenient way to select a single tiny particle and reliably drop it into the field or recover it from the field.

In their experiments, Kane and Coppock first create an electric field designed to capture charged particles inside a vacuum chamber. To levitate a sample, they fill the chamber with many charged nanoparticles and watch to see if one of them falls into the field. After they make their measurements of that lucky particle, it gets released and becomes just another anonymous, invisible nanoparticle scattered about the vacuum chamber.

But Kane and Coppock had an idea for how to recover samples. Instead of just dropping the electric field and letting the particle fly in a random direction, they realized they could adjust the field to give it a shove in a particular direction as they released it. Then they just had to see if they could get the tiny projectile to land in an area they could easily search.

The pair placed a removable glass slide coated with a thin, conductive layer in the chamber as their target. Connecting a charge sensor to the conducting film allowed them to detect if an electrical charge landed on the slide. They also pointed a camera at the slide. The camera couldn’t watch the nanoparticles as they traveled, but each nanoparticle is just large enough that it will normally show up as a change of a single pixel in the camera image.

The pair’s calculations suggested that if a graphene sheet lands flat on the prepared slide it should stick. However, when they tried out the experiment, they kept measuring a spike in charge at the target—suggesting it hit—but almost never spotted where the sample landed. They suspected that most samples were bouncing off the slide or landing outside the area their camera covered.

So, they simplified the experiment by switching their projectile. Instead of using sheets of graphene that need to land perfectly flat, they tried spherical gold nanoparticles, which can be more uniformly produced and don’t have a preferential orientation for making contact. Kane and Coppock were already familiar with working with gold nanoparticles from previous experiments in which they levitated them and melted them with laser light.

Similar to the graphene sheets, the gold spheres were detected by the charge sensor but then couldn’t be found in the camera image. So, Kane and Coppock applied their melting technique to allow each particle to squish a little when it lands, greatly increasing the chance of sticking. All that was required to melt the gold was to turn up the power on the laser they already had installed for studying samples.

“Lo and behold, the minute we started doing that, we started seeing images on the camera,” says Coppock. “So basically, what was needed was to increase the adhesion by melting the particle.”

After that, they could reliably find the particles. However, repeated tries revealed that a sequence of deposited samples tended to spread far apart on the slide. Being able to place a sample in a consistent area would make the technique more useful and increase their chances of finding deposited graphene samples down the road.

“It's like the problem that people have going to the moon, right?” says Coppock. “You're a tiny person on Earth, and you have to get yourself a long distance to the moon. If you just launched yourself off the Earth, there's no way you would hit the moon. If we just launched the particle out of the trap, there's no way it would both hit the substrate and we would know where it was on the substrate. Finding a 200-nanometer particle on a one-inch sized substrate is like finding a needle in a haystack.”

So, they started working on the consistency with which they launched their tiny samples. The same electrical charge that allows Kane and Coppock to levitate the particles, also allows them to guide particles on the way to the slide. They surrounded the path they wanted the nanoparticles to follow with metal rings and then applied a voltage to the rings during the journey. The applied voltage creates an electric field that nudges a nanoparticle back onto a narrower path if it starts to stray. The way the electric fields bend charged particles back to a central focal point resembles a glass lens focusing light, so researchers call the setup an electrostatic lens.

By experimenting with the voltages that they used to launch the sample and guide it along its path, they were able to change where the particles tended to end up. They adjusted the voltages from a low setting where the samples spread over an area roughly 3,000 micrometers wide to a higher setting where all the particles clustered in an area about 120 micrometers across.

Plots of where gold particles from repeated runs of the experiment landed. The colors of the dots reflect the voltages applied to achieve electrostatic lenses of various strengths. The weakest lens (light blue dots) spread the samples across an area that is about 3,000 micrometers wide, and the strongest lens (red dots) focused all the particles into a cluster just 120 micrometers across. The lower right frame has increased magnification to show the distribution of particles within the cluster created by the strongest lens. (Credit: Laboratory for Physical Sciences)Plots of where gold particles from repeated runs of the experiment landed. The colors of the dots reflect the voltages applied to achieve electrostatic lenses of various strengths. The weakest lens (light blue dots) spread the samples across an area that is about 3,000 micrometers wide, and the strongest lens (red dots) focused all the particles into a cluster just 120 micrometers across. The lower right frame has increased magnification to show the distribution of particles within the cluster created by the strongest lens. (Credit: Laboratory for Physical Sciences)

If the initial scatter area were scaled up to the size of a dartboard, then their improved aim was like clustering their golden darts well within the outer bullseye. This is even more impressive since the scaled-up version of each gold bead is a dart only as wide as a human hair and is being thrown from the equivalent of about 35.5 meters away—about 15 times the normal distance between a dartboard and the throw line.

Moving forward, Kane and Coppock hope to further improve their ability to focus samples into a particular area and to use their refined aim in attempts to recover deposited graphene samples.

Original story by Bailey Bedford: https://jqi.umd.edu/news/researchers-play-microscopic-game-darts-melted-gold


IceCube Search for Extremely High-energy Neutrinos Contributes to Understanding of Cosmic Rays

Neutrinos are chargeless, weakly interacting particles that are able to travel undeflected through the cosmos. The IceCube Neutrino Observatory at the South Pole searches for the sources of these astrophysical neutrinos in order to understand the origin of high-energy particles called cosmic rays and, therefore, how the universe works. 

IceCube has already shown that neutrinos can exist up to about 10 PeV in energy, but both experimental and theoretical evidence suggests extremely high-energy (EHE) neutrinos should reach higher energies. One component, called cosmogenic neutrinos, are expected to be produced when the highest energy cosmic rays interact with the cosmic microwave background. These EHE neutrinos would have an astounding one joule of energy per particle, or higher.

By understanding the properties of cosmogenic neutrinos, such as their quantity and distribution in energy, scientists are hoping to solve the 100-year-old mystery of the origin of ultra-high-energy cosmic rays (UHECRs), with energies exceeding 1 EeV. In a study submitted to Physical Review Letters, the IceCube Collaboration presents a search for EHE neutrinos using 12.6 years of IceCube data. The nondetection of neutrinos with energies well above 10 PeV improves the upper limit on the allowed EHE neutrino flux by a factor of two, the most stringent limit to date. The collaborators also used the neutrino data to probe UHECRs directly. This analysis is the first result using neutrino data to disfavor the hypothesis that UHECRs are composed only of protons.

This figure shows the neutrino landscape at the highest energies between a few PeV and 100 EeV (1020 eV). The red line shows the flux limit we set due to not observing any neutrinos with extremely high energies. It is compared to the previous IceCube result using 9 years of data and to a measurement made by the Auger collaboration. Models of the extremely high-energy neutrino flux are shown in grey (cosmogenic neutrinos) and light blue (neutrinos from AGN), which we can also constrain with our analysis. Credit: IceCube CollaborationThis figure shows the neutrino landscape at the highest energies between a few PeV and 100 EeV (1020 eV). The red line shows the flux limit we set due to not observing any neutrinos with extremely high energies. It is compared to the previous IceCube result using 9 years of data and to a measurement made by the Auger collaboration. Models of the extremely high-energy neutrino flux are shown in grey (cosmogenic neutrinos) and light blue (neutrinos from AGN), which we can also constrain with our analysis. Credit: IceCube CollaborationIn the search for EHE neutrinos, researchers looked for neutrino “events” where neutrinos deposited a huge amount of light inside the detector. However, because most high-energy neutrinos are absorbed by the Earth, the focus of the study shifted to neutrinos arriving sideways at (horizontal) or above (downgoing) IceCube. Focusing on horizontal events in particular also allowed the researchers to eliminate most of the overwhelming background of atmospheric muons caused by cosmic-ray interactions above IceCube in the atmosphere.

 Using a novel method developed by Maximilian Meier, an assistant professor at Chiba University in Japan and colead on the study, they were able to identify how “clumpy” or stochastic an event was, which was helpful because true neutrino events are more stochastic than the cosmic-ray background.

“The non-observation of cosmogenic neutrinos tells us, under some pretty conservative modeling assumptions, that the cosmic-ray flux is mostly composed of elements heavier than protons,” says Brian Clark, an assistant professor at the University of Maryland and colead on the study. “This is a big open question and something scientists have been trying to answer for almost one hundred years.” 

Clark adds that the two other large-scale particle astrophysics experiments—the Pierre Auger Observatory and the Telescope Array—have been trying to answer the same question for almost a decade. Because they measure the cosmic-ray air showers directly, interpreting the data relies on sophisticated modeling of the nuclear physics of cosmic-ray interactions. This is where IceCube offers a complementary approach that, as described in the paper, is largely insensitive to those modeling uncertainties. This makes it an important, independent confirmation of the results obtained by air shower experiments. Brian ClarkBrian ClarkMaximilian MeierMaximilian Meier

“This is the first time a neutrino telescope has managed to do this. And it was a major promise of the discipline, so it’s very exciting to see it happen,” says Clark. 

Future studies by the IceCube Collaboration will look to machine learning in order to extract the most out of the IceCube data. 

“We are really excited to see the next generation of detectors, like IceCube-Gen2, come online, which will be ten times larger than IceCube and, therefore, significantly increase our capabilities to detect cosmogenic neutrinos in the future,” says Meier.

+ info “A search for extremely-high-energy neutrinos and first constraints on the ultra-high-energy cosmic-ray proton fraction with IceCube,” IceCube Collaboration: R. Abbasi et al. Submitted to Physical Review Letters. arxiv.org/abs/2502.01963

Original story by